ALTQ Traffic Shaper Queue Monitoring
The page at Status > Queues displays ALTQ traffic shaper queue usage. Monitor this page to ensure that traffic shaping is working as intended.
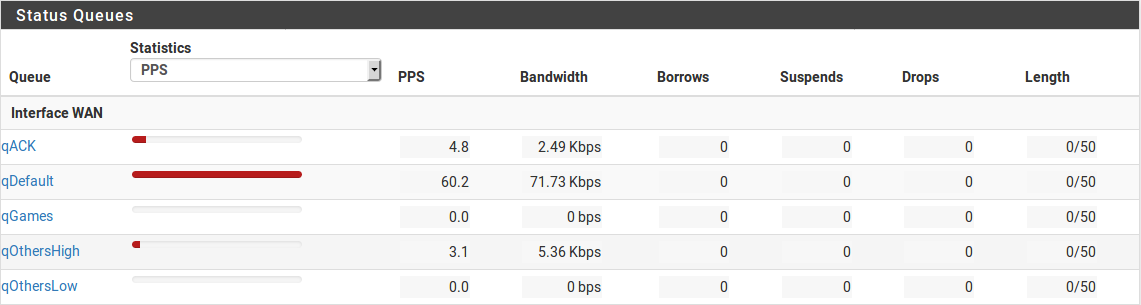
Figure Basic WAN Queues shows each queue listed by name, its current usage, and other related statistics.
Basic WAN Queues
Queue Status Columns
- Queue:
The name of the traffic shaper queue.
- Statistics:
A graphical bar which shows how “full” this queue is.
- PPS:
The rate of queued data in packets per second (PPS)
- Bandwidth:
The rate of queued data in bits per second (e.g. Mbps, Kbps, bps).
- Borrows:
Borrows happen when a neighboring queue is not full and capacity is borrowed from there.
- Suspends:
The suspends counter indicates when a delay action happens. The suspends counter is only used with the CBQ scheduler and should be zero when other schedulers are in use.
- Drops:
Drops happen when traffic in a queue is dropped in favor of higher priority traffic. Drops are normal and this does not mean that a full connection is dropped, only a packet. Usually, one side of the connection will see that a packet was missed and then resend, often slowing down in the process to avoid future drops.
- Length:
The number of packets in the queue waiting to be transmitted, over the total size of the queue.
Queue Status Options
There are two options on the page which control the output:
- Refresh Rate:
Controls how frequently the page updates itself automatically. This defaults to
1second, but can set between0.5seconds and5seconds.- Statistics:
Controls which data point is used to when generating bar graphs for queue content. This can be PPS (Default) or Bandwidth.