Netgate Nexus Dashboard
The Netgate Nexus GUI dashboard contains an overview of all instances managed by this controller (Multi-Instance Management).
Netgate Nexus Controller Dashboard
Access the Netgate Nexus GUI
Before proceeding, open the Netgate Nexus GUI as described in Accessing the Netgate Nexus GUI and login.
Tip
Accessing the Netgate Nexus GUI on the controller will allow administrators to manage any instance registered with the controller. The Netgate Nexus GUI on instances can only manage the local instance.
After logging in, the Netgate Nexus GUI displays its dashboard.
Status Summary
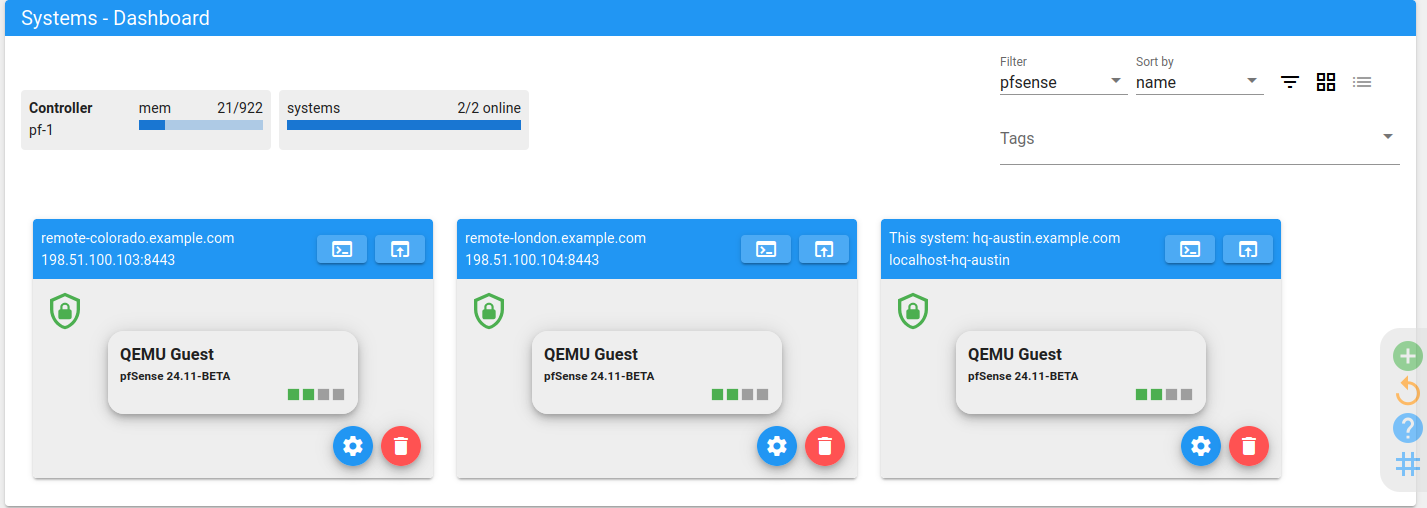
The dashboard contains status summary items in the upper left.
The first status item reports the current controller memory usage, both in text form and as a gauge.
The second status item reports the total number of registered instances and their online status.
Note
The controller host itself is not included in the systems summary as it would be redundant – if the controller was offline, the dashboard could not be loaded.
Instance List Entries
The instance list in the dashboard contains an entry for every instance registered with the controller, plus the controller itself.
Each list entry contains several items indicating the status of the instance, management controls, and options.
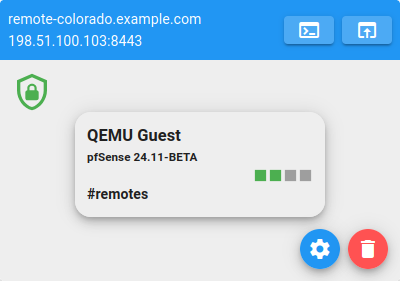
Instance List Entry
- Hostname:
The hostname of the instance is printed in the bar at the top of the instance entry at the upper left.
- Address:
The IP address and Netgate Nexus GUI port is printed in the bar at the top of the instance entry under the hostname.
- Management Controls:
The upper right area of the bar at the top of the instance entry contains two icons to manage the instance:

Opens a Remote Console on the instance.

Enters the Remote Configuration interface for the instance.
- Status Icon:
In the upper left of the main area of the instance entry is an icon indicating its status. Possible states include:
Online:

Error:

- Device Type:
The first line of text in the instance body is the type of device. This can be a hardware model, hypervisor type, cloud provider, etc.
- Version Information:
The current software version is printed under the device type.
- Interface Status:
The instance entry contains a row of squares indicating network interface status for the device. Connected interfaces are green, disconnected or disabled interfaces are gray. Hover the mouse cursor over a square to see its name and link speed.
- Tags (If present):
Entries can be classified via tags (Tag Manager). If an instance has assigned tags, they are printed here.
- Entry Options:
The
 icon opens a modal dialog window with general options for
this instance entry.
icon opens a modal dialog window with general options for
this instance entry.- Remove Entry:
The
 icon deregisters (removes) this entry from the controller.
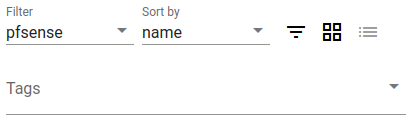
Instance List Filter & Sort
The list of instances on the dashboard can be filtered and sorted to locate and manage items easier. The options to filter and sort the list are in the upper right area of the dashboard.
Instance List Filter & Sort Controls
In that area, the following options are available:
- Filter:
This drop-down menu allows filtering the list by item type.
- Sort By:
This drop-down menu sorts the items on the dashboard by a specific attribute.
The current sort options are:
- Name:
Sorts by instance hostname.
- State:
Sorts by online/error status.
- Address:
Sorts by IP address.
- Type:
Sorts by device type.
- Tags:
Enter a tag name to filter the list so it only shows items matching a specific tag or multiple tags.
- Sort Order:
The sort order icon toggles between ascending (
 ) and
descending (
) and
descending ( ) sort order.
- Tile View:
Clicking the
 icon switches the dashboard to tile view,
which is the default.
icon switches the dashboard to tile view,
which is the default.- Detail View:
Clicking the
 icon switches the dashboard to a detailed
list view.
icon switches the dashboard to a detailed
list view.
Dashboard ToolBox
The Netgate Nexus Dashboard ToolBox is located on the right side of the dashboard screen and contains several options to manage dashboard items.
This ToolBox can appear in two different ways as determined by the Controller Options.
It can be a floating bar pinned to the right side of the screen:
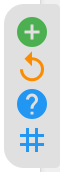
Dashboard ToolBox - Right Side Style
It can be collapsed behind a
 hamburger menu button:
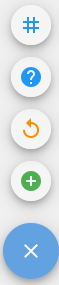
Dashboard ToolBox - FAB Style
The available actions are the same in both styles.
The actions available in the ToolBox are:

Register an instance with the controller (Instance Registration).

Reload dashboard data.

Open the Help menu which also contains the current controller data for use in the registration process (Instance Registration).

Opens the tag manager which assigns tags to dashboard list entries (Tag Manager).
Tag Manager
Dashboard items can be tagged to allow filtering entries based on custom keywords. To assign tags to instances, open the Tag Manager from the Dashboard ToolBox.
The Tag Manager can add or remove tags from one or more instances as follows:
Click Select Devices
Pick devices from the list, or click Select All
Click in the Tags field
Enter a tag name
Press
Tab, pressEnter, or click out of the Tags fieldClick the desired action:
to add the tag to the selected
instances, or to remove the tag from the selected instances.