Viewing the Firewall Log
The firewall creates log entries for each rule configured to log and for various other internal rules such as default deny rules. There are several ways to view these log entries, each with varying levels of detail. There is no particular best method as it depends on preferences and skill level of the firewall administrators, though using the GUI is the easiest method.
Tip
The logging behavior of the default deny rules and other internal rules can be controlled using the Settings tab under Status > System Logs. See Logging Preferences for details.
Like other logs, the firewall log only retains a certain number of entries. If the needs of an organization require a permanent record of firewall logs for a longer period of time, see Remote Logging with Syslog for information on copying these log entries to a syslog server as they happen.
See also
Viewing in the GUI
To view firewall logs in the GUI, navigate to Status > System Logs, Firewall tab.
By default, this page parses and renders firewall log entries in an easy-to-read format.
Example Log Entries Viewed From The GUI
See also
Several aspects of firewall log display behavior are controlled by options on the Settings tab. See Log Settings for information on how to view and change these log settings.
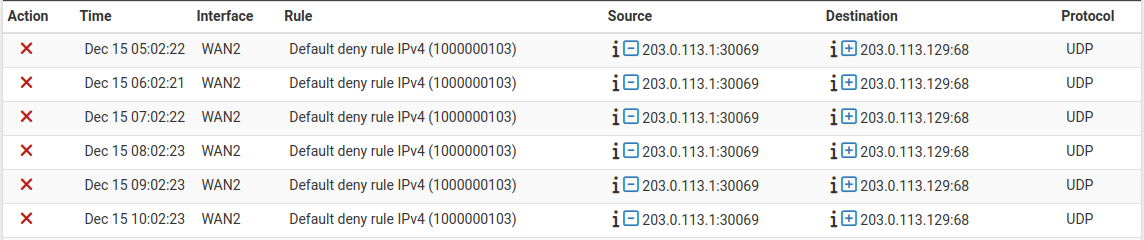
The parsed GUI logs, shown in Figure Example Log Entries Viewed From The GUI, are in multiple columns:
- Action:
Icon representing the firewall rule action which resulted in the log entry (e.g. pass or block).
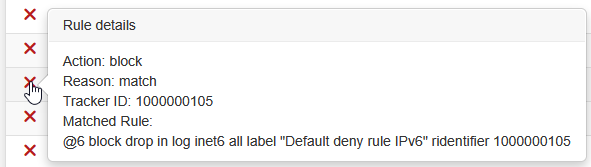
Hovering the mouse over the action icon displays several details about the log entry in a popup, including which rule triggered the log entry. These details can be useful when troubleshooting rule issues.
Firewall Log Entry Detail
The details displayed by this view include:
- Action:
Full text of the firewall rule action which triggered this log entry (e.g. Pass, Block, etc.)
- Reason:
The reason the log entry was generated, e.g.
match. There are several possible reason strings which are typically self-explanatory based on the text, such asmatchbeing from a packet matching a rule. Reasons can also include things like state mismatches, checksum mismatches, time mismatches, hitting state limitations, or even the presence of IP options.- Tracker ID:
The firewall Rule Tracking ID which uniquely identifies this rule.
- Matched Rule:
The rule which matched this packet, if the firewall was able to locate the rule.
- Associated Rules:
A list of rules with the same tracking ID as the rule which generated the log entry. This can help narrow down which rule may have triggered a log entry when the firewall could not locate an exact match.
- Time:
The time that the packet arrived.
- Interface:
Where the packet entered the firewall.
The GUI prints a ► character next to the interface if a rule matched a packet in the outbound direction. The vast majority of rules match in the inbound direction, so the direction is omitted in that case.
- Rule:
The firewall rule description and rule tracking ID which generated the log entry, if available. This column only appears when rule descriptions are configured to appear in a separate column. They may also be shown in a separate row, or disabled entirely.
See also
- Source:
The source IP address and port.
Clicking the
 icon next to the source and destination IP addresses
makes the firewall perform a DNS lookup on the IP address. If the address has
a valid hostname, the page will display it underneath the IP address in all
instances of that address on the page.
icon next to the source and destination IP addresses
makes the firewall perform a DNS lookup on the IP address. If the address has
a valid hostname, the page will display it underneath the IP address in all
instances of that address on the page.Clicking the
 icon next to the source IP address or the
 icon next to the destination IP address will
add firewall rules based on those addresses using EasyRule.
icon next to the destination IP address will
add firewall rules based on those addresses using EasyRule.- Destination:
The destination IP address and port.
- Protocol:
The protocol of the packet, e.g. ICMP, TCP, UDP, etc.
Log entries for TCP packets have extra information appended to the protocol field displaying TCP flags present in the packet. These flags indicate various connection states or packet attributes.
See also
The GUI can also filter log output to find specific entries, so long as they
exist in log files on the device. Click  to display the filtering
options. See Filtering Log Entries for more information.
to display the filtering
options. See Filtering Log Entries for more information.
Viewing from the Shell
When using the shell, either from SSH or from the console, there are numerous options available to view the filter logs.
When directly viewing the contents of the log file, the log entries can be quite complex and verbose.
For information on viewing logs from the shell, see Working with Log Files.
Viewing parsed log output in the shell
There is a simple log parser written in PHP which can be used from the shell to produce reduced output instead of the full raw log. To view the parsed contents of the current log, run:
# cat /var/log/filter.log | filterparser.php
The script prints the log entries one per line, with simplified output:
Aug 3 08:59:02 block igb1 UDP 198.51.100.1:67 198.51.100.2:68
Finding the rule which caused a log entry
When viewing one of the raw log formats, the log includes the Rule Tracking ID for an entry. This tracking ID can be used to find the rule which caused the match.
The following example locates the rule with a tracking ID of 1000000103:
# pfctl -vvsr | grep 1000000103
@4 block drop in log inet all label "Default deny rule IPv4" ridentifier 1000000103
As shown in the above output, this was the default deny rule for IPv4.