Working with Graphs
The firewall displays a graph showing its CPU usage by default. To view other graphs or to add a second category on another axis, the graph settings must be changed as described in the next section, Graph Settings.
Inside the graph, the labels in the top left corner note the sources for the data in the left axis and right axis.
The graph contains a legend at the top right with each of the data sources plotted on the graph. Clicking a data source in the legend will hide it from view.
Tip
If a data source has a large spike, click its name in the legend to remove it from the graph. With the larger data source removed, more detail from the other remaining sources will be visible.
The firewall hostname, graph time period, and graph resolution are printed along the bottom of the graph, along with the time the graph was generated.
The firewall prints a table below the graph itself with a summarization of the data. This table contains minimums, averages, maximums, current values, in some cases 95th percentile values. In cases where units are given, hovering the mouse pointer over the unit will display a more detailed description of the unit.
Note
Totals are not displayed because the way data is stored in RRD files, accurate totals are not possible. To see total usage for traffic on network interfaces, install the Status Traffic Totals package.
Figure WAN Traffic Graph shows an example of an 8-hour graph of traffic on a firewall interface named CABLE with inverse enabled. The interface has a maximum utilization of 9.96Mbit/s during a one-minute period.
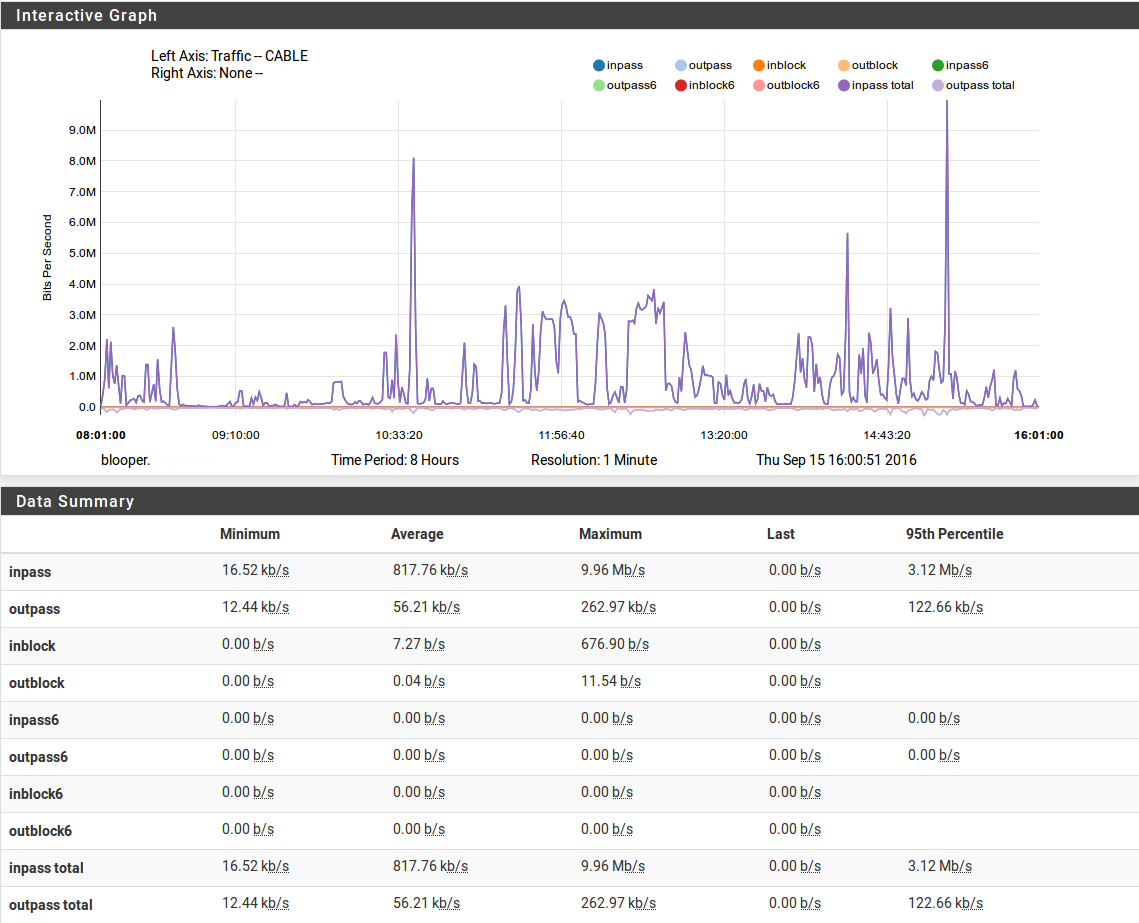
WAN Traffic Graph