System Logs
pfSense® software logs a lot of data by default, but does so in a manner that
attempts to avoid overflowing the storage on the firewall. The GUI has pages
which display and manage logs under Status > System Logs and the log files
themselves are under /var/log/ on the file system.
Some services, such as DHCP and IPsec, generate enough logs that they have their own log files and tabs in the GUI. This reduces clutter in the main system log and makes it easier to troubleshoot these individual services. To view other logs in the GUI, click the tab for the subsystem to view. Certain areas, such as System, and VPN, have sub-tabs with additional related options.
Log Format
pfSense® Plus software version 21.02 and pfSense CE software version 2.5.0 use plain text log files. The firewall periodically rotates these log files to keep their size in check. The rotation behavior is controlled by the log settings (Log Rotation Settings).
For each separate log, the firewall has is one main log file plus a number of rotated log files. The firewall compresses rotated log files by default on most installations, but this compression is disabled for systems running ZFS as ZFS already compresses this data. The GUI understands each compression option and displays and searches contents of rotated log files in addition to the main log file. This adds processing time but vastly increases the amount of log data available to the GUI.
pfSense® software versions older than 21.02/2.5.0 used a binary circular log
format known as clog to maintain a constant log size without the need for
rotation. As syslogd wrote new entries to a clog file, it removed older
entries automatically. As such, the older data was lost.
Though there were multiple benefits to binary circular logs, such as restricting log file sizes, the downsides were too significant on modern systems. Among other reasons, binary circular logs were not very flexible, could not be used directly by shell utilities, were susceptible to corruption, and could not reliably store larger amounts of log data. Furthermore, the original justification for size restrictions were primarily based on hardware choices from over a decade ago. Hardware, even embedded system hardware, is much more capable now.
Tip
If log retention is an issue for an organization, the logs can be copied to another server with syslog where they may be permanently retained or rotated with less frequency. See Remote Logging with Syslog later in this chapter for information about syslog.
On normal installations where logs are kept on disk, they are retained across
reboots. When /var is in a RAM disk, the system attempts to back up the logs
at shutdown and restore them when booting. If the system does not shut down
cleanly, the logs will reset.
Viewing System Logs
The GUI interface to view system logs is located at Status > System Logs, on the System tab. This includes log entries generated by the host itself in addition to those created by services and packages which do not have their logs redirected to other tabs/log files.
As shown by the example entries in Example System Log Entries, there are log entries from several different areas in the main system log. Many other subsystems will log here, but most will not overload the logs at any one time. Typically, services which generate a significant volume of log entries have their own tab and log file.
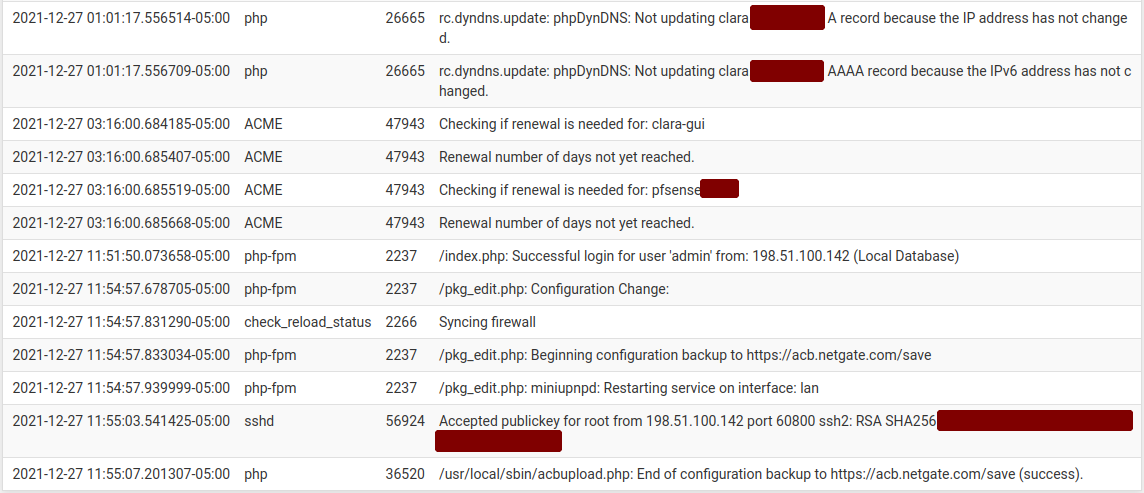
Example System Log Entries
Filtering Log Entries
The GUI can search and filter every log to find entries matching specific patterns. This is useful for tracking down log entries from a single service or log messages containing a specific username, IP address, and so on.
To search for log entries:
Navigate to Status > System Logs
Click the tab for the log to search
Click
 in the breadcrumb bar to open the Advanced Log Filter
panel
in the breadcrumb bar to open the Advanced Log Filter
panelEnter the search criteria, for example, enter text or a regular expression in the Message field
Click
Apply Filter
The filtering fields vary by log tab, but may include:
- Message:
The body of the log message itself. A word or phrase may be entered to match exactly, or use regular expressions to match complex patterns.
- Time:
The timestamp of the log message. Uses month names abbreviated to three letters.
- Process:
The name of the process or daemon generating the log messages, such as
sshdorcheck_reload_status.- PID:
The process ID number of a running command or daemon. In cases where there are multiple copies of a daemon running, such as
openvpn, use this field to isolate messages from a single instance.- Quantity:
The number of matches to return in filter results. Setting this value higher than the number of log entries in the log file will have no effect, but setting it higher than the current display value will temporarily show more log messages.
The Firewall log tab has a different set of filtering fields:
- Source IP Address:
The source IP address listed in the log entry.
- Destination IP Address:
The destination IP address listed in the log entry.
- Pass:
Check this option to only match log entries that passed traffic.
- Block:
Check this option to only match log entries that blocked traffic.
- Interface:
The friendly description name of the interface to match (e.g.
WAN,LAN,OPT2,DMZ.)- Source Port:
The source port of the log entry to match, if the protocol uses ports.
- Destination Port:
The destination port of the log entry to match, if the protocol uses ports.
- Protocol:
The protocol to match, such as TCP, UDP, or ICMP.
- Protocol Flags:
For TCP, this field matches the TCP flags on the log entry, such as
SA(SYN+ACK) orFA(FIN+ACK)
Tip
The filter pane is hidden by default, but the Log Filter setting under System > General Setup can alter this behavior. When set, the GUI expands the filter pane on the log pages at all times.